DCManage reads traffic counters from your switches directly, attributes them to the customer whose cable they arrived on, and keeps the evidence. No agent on the machine, no third party holding your figures.
Every screenshot below is the running product, photographed from the application itself.
Features
Built by an operator who was tired of guessing
Each of these exists because something went wrong without it. The reasoning is in the documentation, not hidden behind a sales call.
Measured, not estimated
Counters are read from the switch over SNMP on a schedule the operator sets. A missed poll is recorded as a gap rather than smoothed over, because a figure that quietly invents the minutes it did not watch is worse than one that admits to them.
Two sources, compared
The platform measures traffic itself and can read an existing PRTG installation alongside. Both figures are shown for the same port, which is the only honest way to decide when the new measurement can be trusted on its own.
Billed on what you sell
Download, upload or both — set per service, per server or per site. The percentile is taken on the direction that is actually invoiced, not on whichever number happens to be larger.
Ports under control
Switch inventory, port discovery, forwarding-table and hardware usage read over the command line. A port can be locked so that neither automation nor a tired operator changes it at three in the morning.
Reach the network you are not on
Management controllers usually sit on a range the management server has no route to. Register a proxy — SOCKS5, SOCKS4 or HTTP CONNECT — and equipment names the one it is reached through. Naming none means direct.
Racks that match reality
Elevation drawings for switches and passive equipment alike, with double-booked units reported rather than silently overlapped. What is drawn is what somebody will find when they open the cabinet.
Who did what, permanently
Roles with individual exceptions, and an audit trail whose UPDATE and DELETE privileges are revoked at the database. Refusals are recorded as carefully as successes, because the attempt is what an operator later wishes had been written down.
Persian and English, equally
One interface, one stylesheet, laid out with logical properties so the right-to-left reading is the real thing rather than a mirrored afterthought. A missing translation fails the build.
Screens
The actual interface
Photographed from the running application against a demonstration estate. Same routes, same templates, same stylesheet you would get.
Sites, racks and what is in them
Open a site and its racks are there; open a rack and every unit is drawn, including the passive equipment nobody usually records.
Datacenters and racks
Sites, the racks in them, and an elevation that reports a double-booked unit rather than overlapping it silently.
Inside a datacenter
One site, its racks, and how full each of them is.
A rack elevation
Every unit drawn, switches and passive equipment alike, with a double-booked unit reported rather than overlapped.
Switches, ports and traffic
Open a switch for its ports, health and hardware usage; open a port for what it carried, whether it is locked, and which machine is behind it.
Switches
Inventory across sites, with what each device is collecting and when it last answered.
Inside a switch
Its ports, what each is doing, its CPU, memory and uptime, and its forwarding-table and hardware usage.
Inside a port
What it carried over any window, its lock state, and the machine and customer behind it.
Machines
Where each one is racked, the ports it is reached through, its management controller and the proxy that reaches it.
Servers
Every machine, where it is racked, the port it is reached through, and its management controller.
Inside a machine
Its rack position, the ports it is patched into, its management controller and the proxy that reaches it.
Customers
A service against its allowance, on the basis it is billed on, with the ports its usage is measured from.
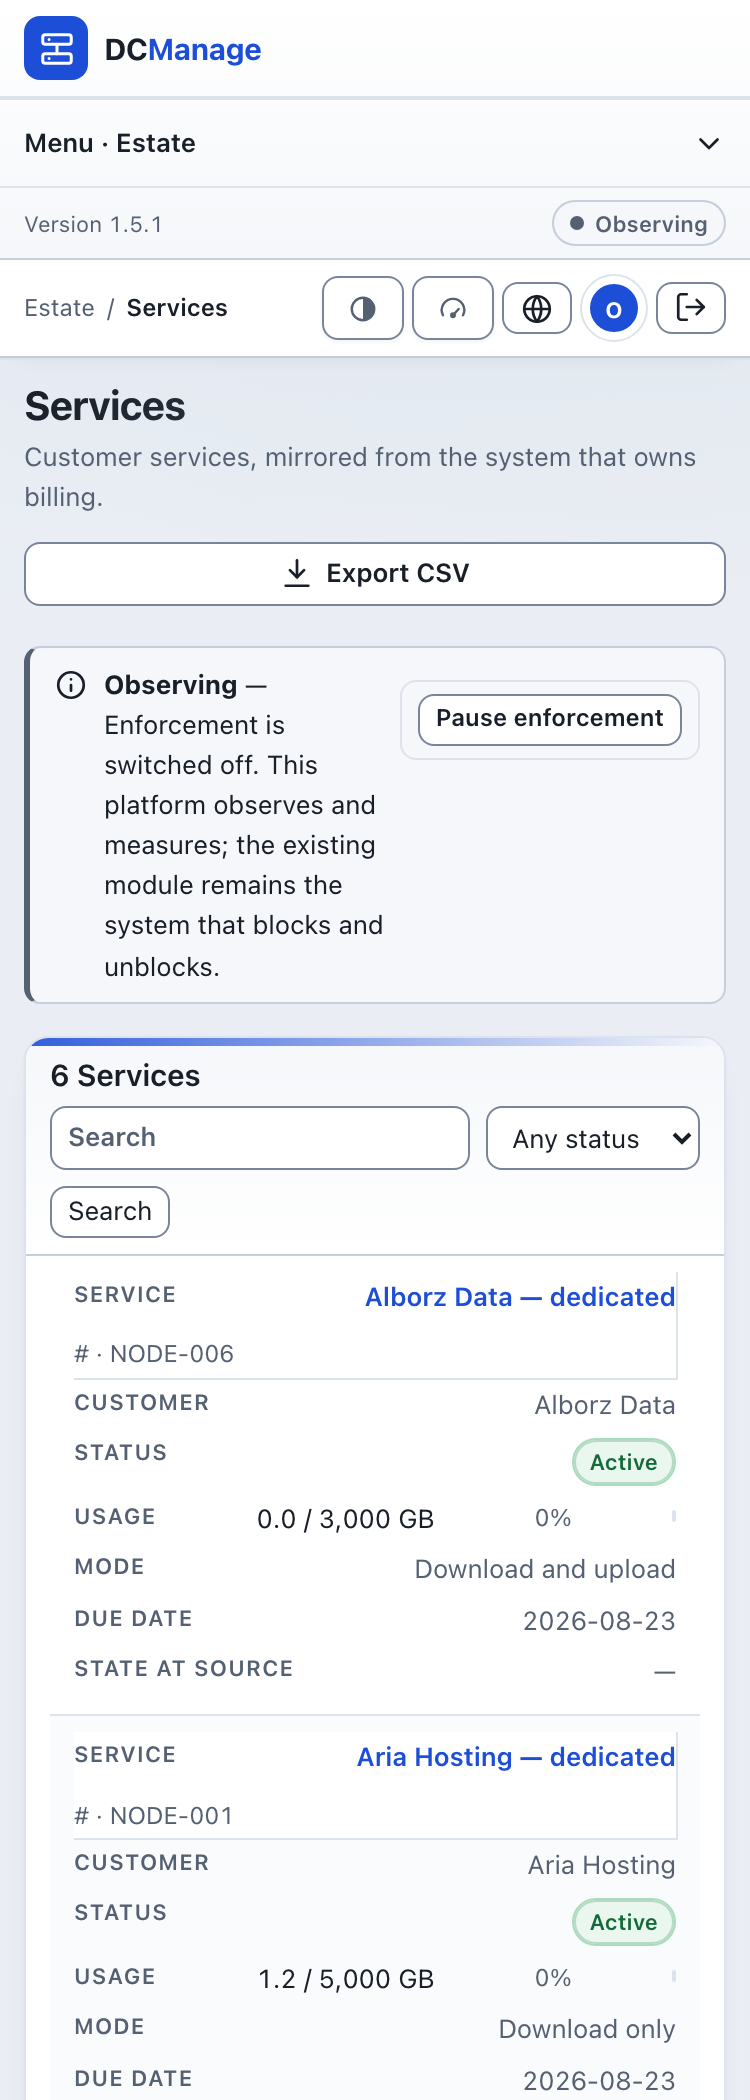
Services and usage
Each customer against their allowance, on the basis they are billed on. Over-quota is marked rather than merely coloured.
Inside a service
Allowance, additional traffic, carried debt, and the ports the usage is actually measured on.
How the platform reaches things
Its own collector, any external monitoring beside it, and the proxies that reach a network this machine has no route to.
Monitoring
Where every figure comes from, stated before the figure. The local collector and any external source are shown separately, because they fail differently and only one of them is yours to fix.
Monitoring sources
External systems read alongside the platform's own collector, with how many of their sensors point at a port we also measure.
Proxies
How the platform reaches a network it is not on, and what is reached through each one.
Administration
Who may do what, what they did, what runs on a schedule, which addresses may connect, and programmatic access.
Roles
Permissions grouped by consequence, with the risky ones marked as such.
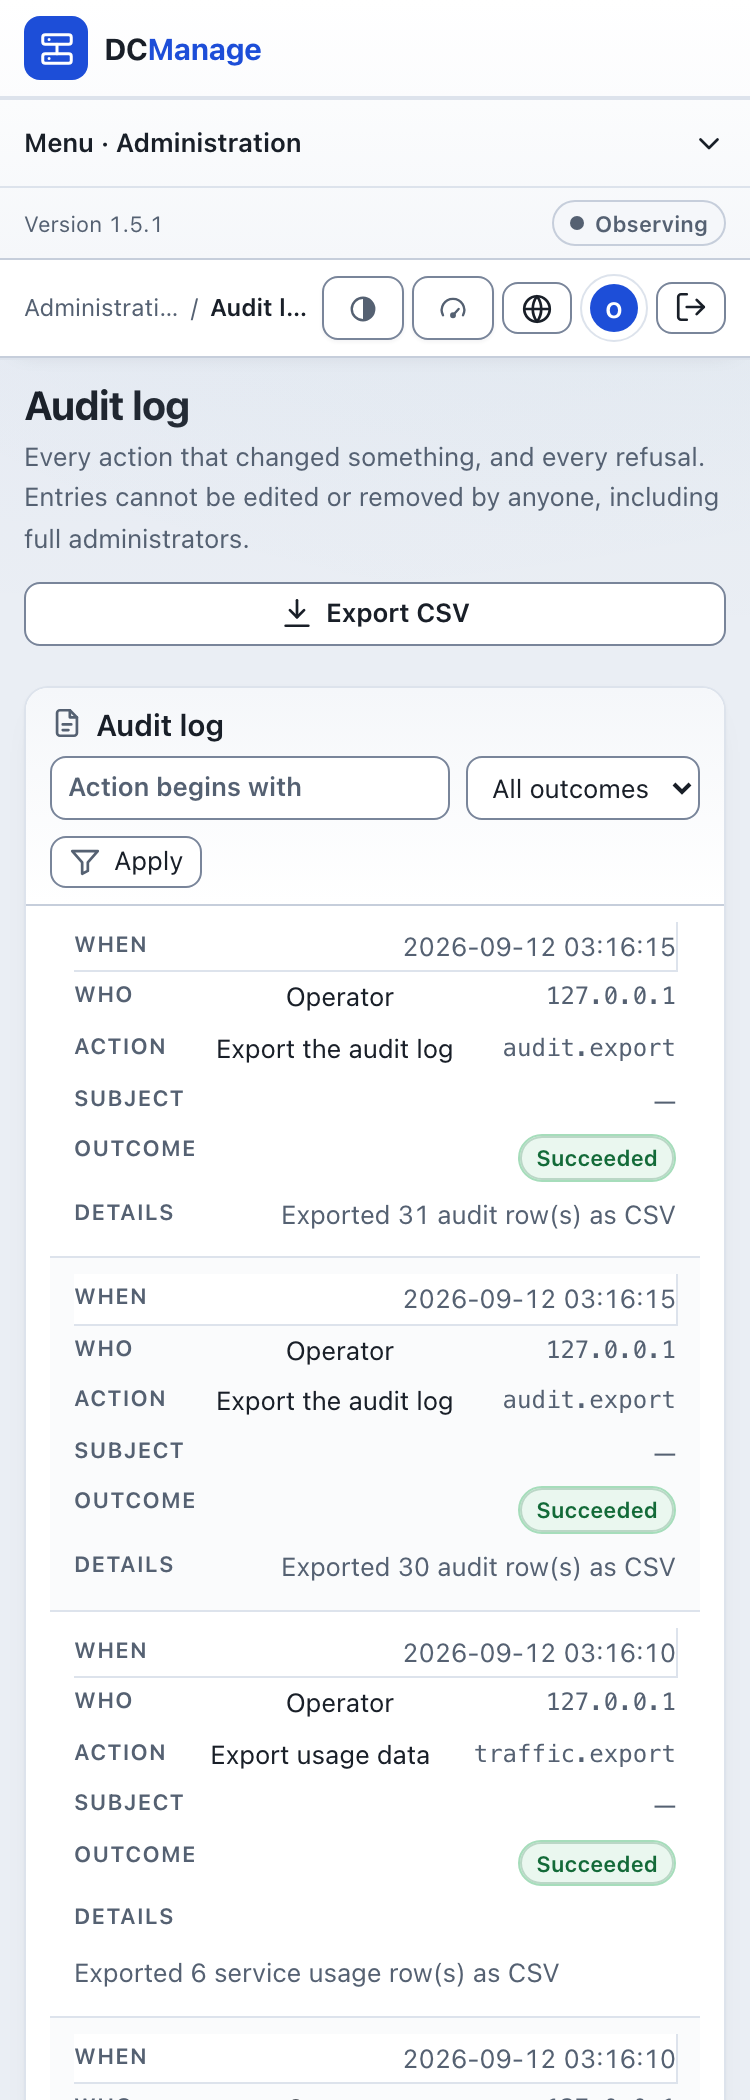
Audit log
Readable statuses over the stored key, so the row can still be filtered on exactly what was recorded.
Scheduler
What runs, when it last ran, and how long it took — so a task that quietly stopped is visible rather than inferred.
Security
Which addresses may reach the panel at all, enforced before the sign-in form is ever drawn.
API keys
Keys with their own permissions, restricted to source addresses, with the secret shown once.
How it works
Three things, in order
Nothing here needs an agent installed on a customer machine, and nothing leaves your network.
Bring the estate in
Sites, racks, switches, ports, servers and services are imported from the system that already holds them, keeping the source identifiers so the two can be reconciled afterwards.
Measure it
A collector reads interface counters on a schedule and writes port-keyed samples. Attribution to a customer is a separate step, which is what stops a port reassignment billing the previous owner.
Decide with it
Usage against allowance, percentiles on the billed direction, and a full record of every decision. Whether the platform acts on what it decides is a switch you control.
Any screen
It works on the phone you had with you
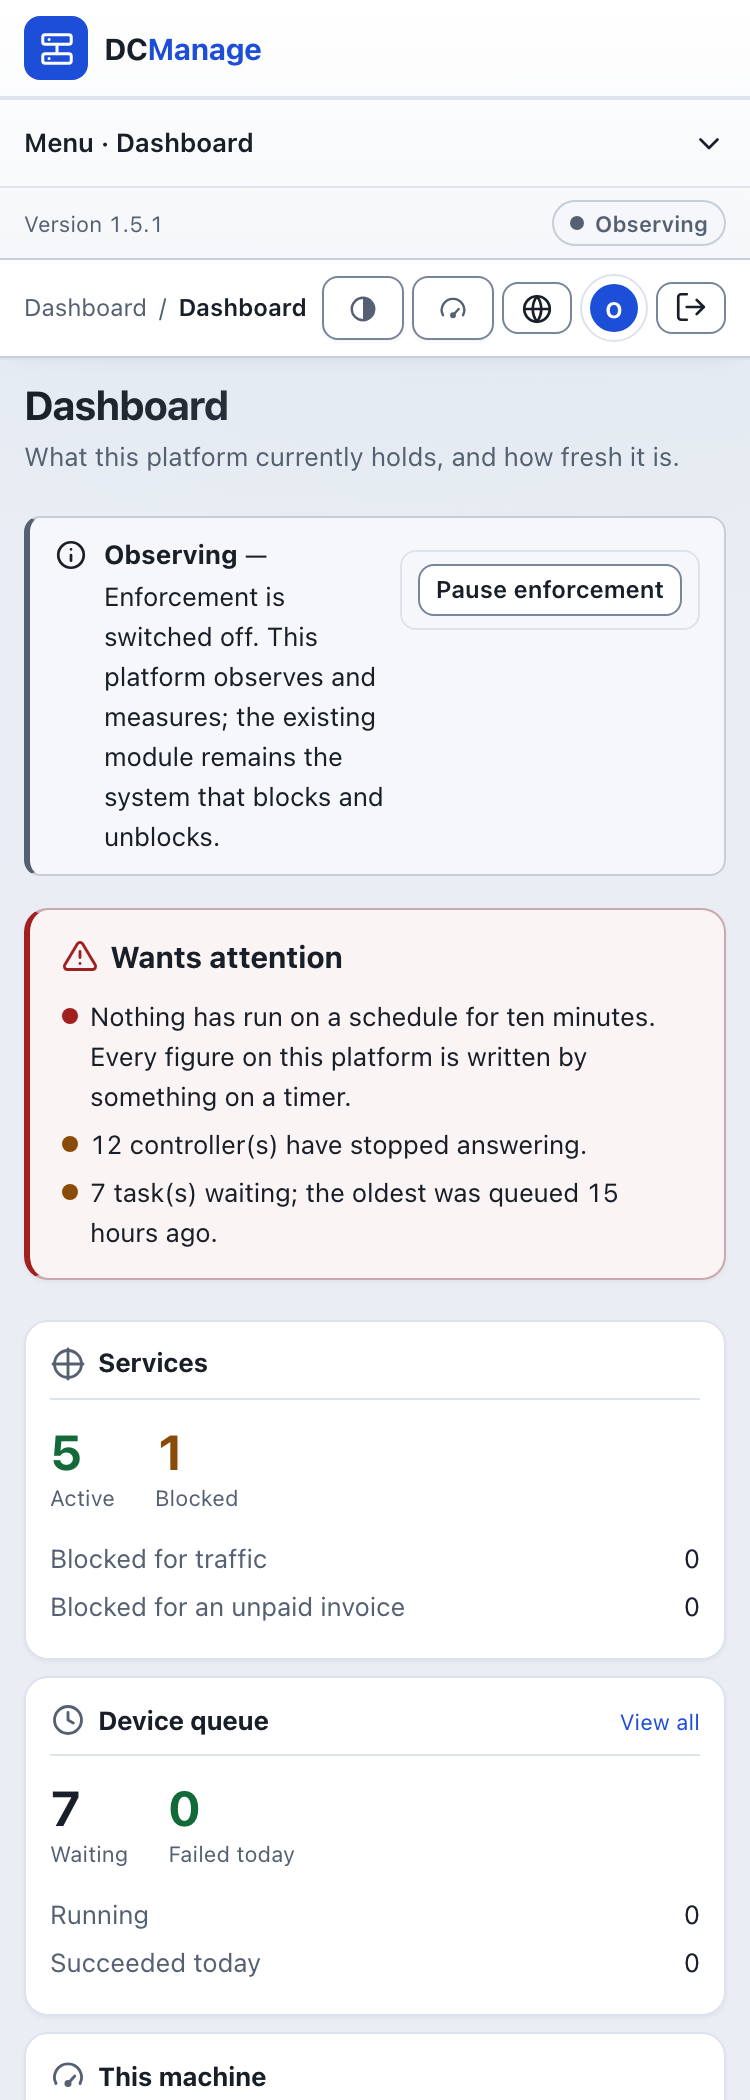
Tables stack into cards that keep their column names, so a row read at three in the morning on a phone says what each number is.
Questions
Will it take a customer offline on its own?
Only if you turn that on. It ships observing: it measures, records what it would have decided, and touches nothing. Arming it requires a full administrator and a typed confirmation.
Does anything leave my network?
No. The panel is served from your own machine and carries no external asset — no font service, no CDN, no analytics — because it is built for networks whose firewall allows only their own address. That rule is enforced by a test, not by good intentions.
How complete is the Persian?
Complete, and checked. Every string used in the code must exist in both catalogues or the test suite fails, and the layout uses logical properties so right-to-left is the same stylesheet rather than a second one that drifts.
I already have PRTG. Do I have to replace it?
No. Register it as a source and the two run side by side on the same ports, so you can compare them over a full billing cycle before trusting either alone.
Where do the figures live?
In your PostgreSQL. Samples are partitioned by day and folded into rollups, and the audit log has its UPDATE and DELETE privileges revoked at the database rather than merely discouraged in code.